
 en
en English
 Español
 Français
 русский
 عربى
عربى
Building a Failure-Cause-Spare Parts Knowledge Base for Downtime Cost Visibility
Content
- 1 Why Downtime Cost Visibility Matters More Than You Think
- 2 The Anatomy of a Failure-Cause-Spare Parts Knowledge Base
- 3 Step 1: Data Collection – Mining Your Existing Sources
- 4 Step 2: Data Structuring – Building the Relationship Model
- 5 Step 3: Cost Attribution – Quantifying Every Downtime Event
- 6 Step 4: Knowledge Base Governance – Keeping It Alive
- 7 Case Study: How a Food Manufacturer Reduced Downtime by 15% with a Knowledge Base
- 8 Conclusion: From Reactive to Proactive – The Strategic Value of Visibility
Why Downtime Cost Visibility Matters More Than You Think
Unplanned downtime costs the global manufacturing sector an estimated $1.4 trillion annually. That headline figure often masks a deeper problem: most organizations cannot accurately attribute that cost to specific failures, root causes, or spare parts consumption. When a production line stops, the immediate financial impact—lost throughput and emergency repairs—gets recorded. But the hidden drains, like overtime premiums, expedited shipping for replacement parts, and the long-term erosion of customer trust, stay invisible because they are never tied to the originating event.
This lack of granular cost visibility leads to flawed capital allocation. You might underinvest in certain critical spare parts because the true cost of their absence was never calculated. Or you might hold excessive inventory for fast-moving items that rarely cause extended outages, simply because procurement sees high usage numbers without context. Without a structured knowledge base linking each failure to its associated costs, your downtime data is just noise, not actionable intelligence.
| Cost Category | Visible Component | Hidden Component |
|---|---|---|
| Lost Production | Units not made during downtime | Overtime to catch up, late delivery penalties |
| Maintenance Labor | Hourly wages for repair work | Pulling technicians from preventive maintenance, higher burnout |
| Spare Parts | Purchase price of the failed part | Expedited freight, holding duplicate inventory "just in case" |
| Quality & Waste | Scrapped in-process material | Rework, customer returns, regulatory non-compliance risk in food sectors |
In food manufacturing, these hidden costs escalate even faster. A line stoppage lasting minutes can force entire batches of perishable dough or sauce to be discarded due to hygiene regulations. Without a system that traces that waste directly back to a bearing failure or a control board burnout, you never see the full financial picture.
The Anatomy of a Failure-Cause-Spare Parts Knowledge Base
At its core, the knowledge base is a relational data model that answers three questions: what failed, why it failed, and which spare part was needed to fix it. Each downtime event becomes a record that links equipment, failure mode, root cause, and the parts consumed, along with the measured durations and costs. This structure turns isolated work orders into a searchable web of cause-and-effect relationships.
The table below outlines the minimal data fields required. Notice that food processing environments demand a few unique additions, such as recipe or formula identifiers and cleaning cycle data, because ingredient variation and sanitation routines frequently trigger failures that generic models overlook.
| Field Category | Field Name | Example |
|---|---|---|
| Asset | Equipment ID / Tag | Encrusting-Machine-Line3 |
| Event | Failure Mode | Forming drum jam |
| Root | Root Cause | Bearing wear due to moisture ingress |
| Part | Spare Part SKU | SKF-6205-2RS |
| Part | Spare Part Cost | $47.20 |
| Time | Downtime Duration (min) | 85 |
| Labor | Maintenance Labor Hours | 2.1 |
| Cost | Estimated Production Loss Value | $2,300 |
| Food-Specific | Recipe/Ingredient Code | Spring-Roll-Wrapper-Batch22 |
| Food-Specific | CIP Cycle Interval (hrs) | 8 |
| Food-Specific | FDA Material Compliance | 3-A sanitary certified |
Building this model creates a feedback loop. When the same failure mode appears across multiple assets, you can quickly query all associated root causes and see which spare parts repeatedly appear. That pattern recognition is the first step toward shifting from reactive firefighting to condition-based interventions. For example, if the knowledge base reveals that 70% of forming drum jams on automatic encrusting machines are caused by worn seals that contaminate the bearings, you can adjust preventive replacement intervals and drastically reduce total downtime cost.
Step 1: Data Collection – Mining Your Existing Sources
You already own most of the raw data. The challenge is that it lives in disconnected silos. Work order systems hold the failure descriptions and timestamps, but rarely do they link to the specific spare part used. Inventory withdrawal logs record which parts left the storeroom, yet they seldom reference the downtime event that triggered the withdrawal. And operator logs may contain invaluable contextual notes—like dough moisture readings—that are never combined with maintenance records.
Start by assembling a cross-functional team to inventory every source of downtime and repair data. The following checklist covers the most common reservoirs.
- Computerized Maintenance Management System (CMMS): Work orders, failure codes, asset histories.
- Inventory Management System: Spare part issuances, restock alerts, cost values.
- PLC / SCADA Historians: Machine alarm logs, cycle counts, downtime timestamps.
- Operator Shift Notes: Manual observations about product quality, unusual noises, or minor stoppages.
- Procurement Records: Emergency purchase orders and expedited shipping costs.
- Quality Logs: Scrap quantities and batch holds triggered by equipment malfunction.
Once the raw feeds are identified, apply three essential cleaning steps before importing anything into the knowledge base. First, de-duplicate work orders that were opened for the same event (a motor alarm may generate multiple tickets within minutes). Second, standardize spare part codes; a single bearing might be described as "BRG-6205," "skf 6205," and "6205-2RS" across systems. Without a unified code, you cannot aggregate part consumption accurately. Third, map legacy failure descriptions to a controlled vocabulary. Terms like "motor stopped," "motor tripped," and "motor overload" must be collapsed into a single failure mode so the database can perform reliable analysis.
Step 2: Data Structuring – Building the Relationship Model
With clean data in hand, the next step is to define the relationships that create a knowledge base rather than a flat list of records. The central link is a many-to-many mapping between failure modes and spare parts. A single failure, such as "conveyor belt slip," can stem from worn tension rollers, a damaged belt, or a misaligned drive pulley. Each root cause points to different spare parts—some of which may also be implicated in other failure modes.
The table below illustrates this interconnected structure for a food forming line. Notice how one root cause can be shared across multiple failure modes, and how even simple parts appear in several rows. This network is what gives the knowledge base its diagnostic power.
| Failure Mode | Root Cause | Spare Part(s) |
|---|---|---|
| Forming drum jam | Bearing wear from moisture | Sealed bearing SKF-6205-2RS, drum seal kit |
| Forming drum jam | Dough moisture too high | N/A (process adjustment); potential scraper blade replacement |
| Conveyor misalignment | Bearing wear from moisture | Sealed bearing SKF-6205-2RS |
| Conveyor misalignment | Worn tension roller | Tension roller assembly, adjustment bolt kit |
| Incorrect fill weight | Fill pump diaphragm rupture | Food-grade diaphragm kit, check valve |
For food machinery, you must also capture process-induced root causes that are invisible in generic models. Dough stickiness, filling temperature, and CIP chemical residues can all instigate mechanical failures. A knowledge base that records the batch code and recipe alongside the mechanical fault enables a manufacturing plant to adjust operating parameters before a pattern becomes a chronic cost driver. Customized forming solutions often include sensor-ready components that simplify this data capture, making it easier to tie process variables directly to failure records.
Step 3: Cost Attribution – Quantifying Every Downtime Event
Visibility only becomes actionable when you attach a dollar figure to each node in the knowledge base. The goal is a downtime cost attribution matrix that breaks every event into its constituent cost buckets: spare parts, maintenance labor, lost production, and quality-related waste. Summing these across all events for a particular asset or failure mode reveals where capital is truly bleeding.
Build the matrix with one row per event. The columns represent the cost dimensions, pulled from the data fields you already cleansed. Over time, aggregating this data will surface the most expensive failure patterns—not necessarily the ones that occur most frequently, but those that carry the highest total impact per occurrence.
| Event ID | Equipment | Failure Mode | Part Cost | Labor Cost | Lost Production Cost | Quality Waste Cost | Total Event Cost |
|---|---|---|---|---|---|---|---|
| E-1042 | Encrusting Machine L3 | Drum jam | $47.20 | $126.00 | $2,300 | $86.00 | $2,559.20 |
| E-1078 | Encrusting Machine L3 | Fill weight drift | $328.00 | $94.50 | $1,100 | $215.00 | $1,737.50 |
| E-1093 | Encrusting Machine L3 | Motor overload trip | $15.00 | $55.00 | $400 | $0.00 | $470.00 |
This matrix makes it easy to calculate a cost-per-failure-mode value. In the example above, drum jams on Encrusting Machine L3 average $2,559 per event. If that happens three times a month, the annual cost exceeds $92,000—enough to fully justify investing $20,000 in a proactive seal replacement program and moisture-resistant bearing upgrade. Without the knowledge base, that business case would never materialize because the expense would be scattered across department budgets.
An often-overlooked dimension in food processing is the cost of product waste that cannot be salvaged due to food safety protocols. Once a line stops, dough and fillings that have been in-process beyond a certain time-temperature threshold must be discarded. Incorporating that data into the attribution matrix requires collaboration with quality and sanitation teams, but it can double the calculated cost of certain failures.
Step 4: Knowledge Base Governance – Keeping It Alive
A knowledge base built once and left to stagnate decays faster than any mechanical asset. New failure modes emerge as recipes change, machines age, and spare part suppliers revise their catalog numbers. Without a governance protocol, your carefully structured data drifts back toward chaos within months.
Establish a closed-loop update process that triggers whenever a novel failure occurs. The maintenance team logs the event in the CMMS, an initial root cause is noted, and the spare parts used are recorded. A reliability engineer or maintenance planner then confirms the linkage, updates the knowledge base, and publishes the change. This simple cycle keeps the relational model current and trustworthy.
- Capture: Document the downtime event with all relevant fields immediately after recovery.
- Analyze: Perform a structured root cause analysis within 48 hours and assign verified causes.
- Map: Update the failure-cause-part relationships and revise the expected spare parts list if new parts were used.
- Cost: Input actual labor, part, and production loss figures, overwriting any initial estimates.
- Validate: The reliability lead reviews the entry for consistency before releasing it to the shared knowledge base.
Schedule quarterly audits in which you validate that spare part SKUs are still active, cost data reflects current pricing, and outdated relationships are deprecated. Integration with an enterprise asset management system automates much of this, but a human checkpoint remains essential, especially when regulatory status changes—such as a food-contact material losing its FDA certification—could render an entire set of spare part recommendations invalid.
Case Study: How a Food Manufacturer Reduced Downtime by 15% with a Knowledge Base
A frozen food producer operating multiple high-speed lines for dumplings and spring rolls faced recurring unplanned stoppages on its automatic dumpling machine. The forming unit would jam without warning, and each event triggered an average of 120 minutes of downtime as maintenance staff hunted through poorly catalogued spare parts bins and disorganized maintenance logs. Technicians reported spending up to 45 minutes simply identifying the correct bearing or seal.
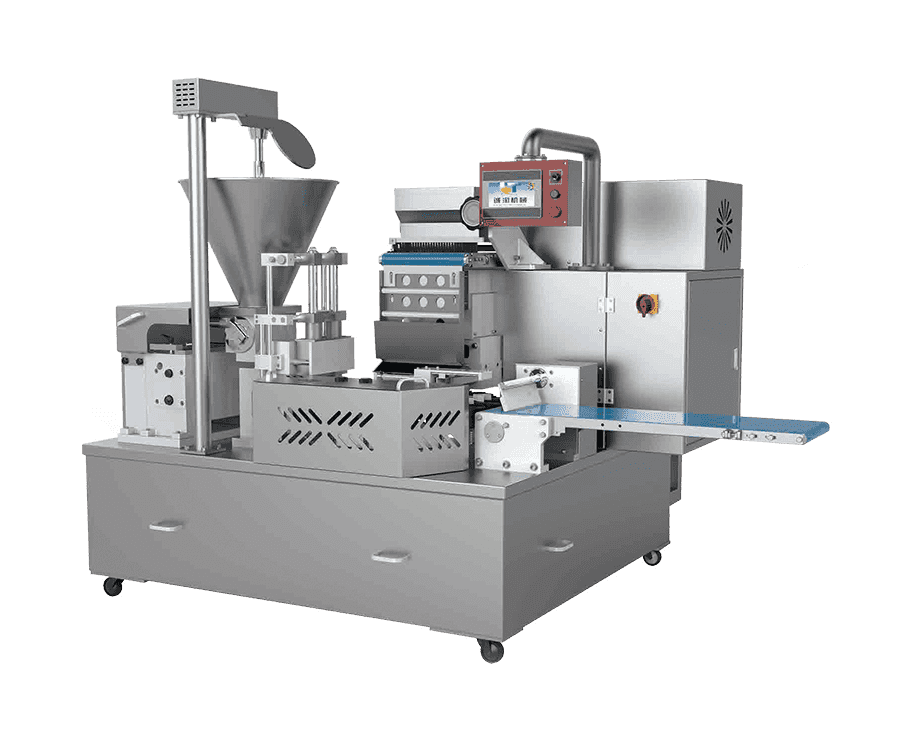
After implementing a failure-cause-spare parts knowledge base, the plant mapped all historical jam events to three dominant root causes: moisture-induced bearing wear, dough formulation drift, and seal degradation from cleaning chemicals. Each root cause was linked to a precise bill of materials that included the specific sealed bearing, food-grade seal kit, and, where relevant, a set of process parameter ranges for the dough mixer upstream. The knowledge base was integrated with the CMMS so that when any drum jam occurred, the system immediately suggested the most probable causes based on past events.
The results were measurable. The mean time to repair (MTTR) for forming unit jams dropped from 120 minutes to 45 minutes, and spare part lookup time collapsed to under 5 minutes per incident. The table below contrasts the before and after KPIs.
| Metric | Before | After | Improvement |
|---|---|---|---|
| MTTR for drum jam | 120 min | 45 min | 62.5% reduction |
| Spare part lookup time | 45 min | 5 min | 89% reduction |
| Avg. downtime cost per jam | $15,000 | $5,600 | 63% reduction |
| Annual unplanned downtime hours (forming unit) | 180 | 62 | 66% reduction |
More importantly, the knowledge base enabled a shift in how the plant managed its inventory. By linking parts to failure probability, the maintenance team reclassified the sealed bearing as a critical A-item and set a reorder point that eliminated emergency purchases. Inventory holding costs for forming-unit spares fell by 20% because the team no longer overstocked parts that the data showed were rarely, if ever, involved in major stoppages.
Conclusion: From Reactive to Proactive – The Strategic Value of Visibility
A failure-cause-spare parts knowledge base does more than document the past. It converts every downtime minute into a teachable moment that shapes future equipment strategies, spare part stocking policies, and capital investment plans. The three most immediate strategic benefits are clear.
- Spare Part Inventory Optimization: ABC-XYZ classification coupled with failure frequency data lets you right-size inventory—holding high-criticality parts close and reducing low-impact items without risking line availability.
- Targeted Preventive Maintenance: When failure trends point to predictable wear patterns, you can replace seals or bearings on a condition-based schedule, eliminating the majority of unplanned events.
- Capital Allocation with Confidence: Asset-level visibility shows which machines are chronic cost centers. If a specific model accounts for 60% of line downtime costs, the business case for an upgrade or redesign writes itself.
Food manufacturers face an extra layer of complexity because product changeovers, sanitation cycles, and ingredient variability inject unique failure modes. The same principles apply nonetheless. The knowledge base you build around your preparation equipment and forming lines becomes the foundation for predictive maintenance programs that account for dough rheology, cooking temperatures, and CIP chemical exposure—factors that generic industry models miss entirely.

The return on this effort is not abstract. The cost of building and governing a knowledge base is typically recovered many times over within the first 12 months, solely through the first avoided emergency spare part shipment and the first correctly anticipated failure. The math is simple: every hour of downtime prevented is direct margin returned.
Related Products
Copyright © Shanghai Chengtao Machinery Co., Ltd. All rights reserved.  Food Machinery Manufacturers
Contact Us