 English
 Español
 Français
 русский
 عربى
عربىOne Machine, Many Products: The Real ROI Behind Mold Changeovers
Content
- 1
- 2 Why "One Machine, Many Products" Changes the ROI Equation
- 3 The Complete ROI Formula for Mold Changeovers
- 4 Comparing QMC Solutions: Hydraulic, Magnetic, and Manual Systems
- 5 The Hidden Costs You Are Not Including (But Should)
- 6 Step-by-Step: How to Audit Your Current Changeover Time
- 7 Case Study: One Machine, Three Products — A Food Manufacturing Example
- 8 Decision Matrix: Which QMC Strategy Fits Your Business?
- 9 Conclusion: Making the Investment Case to Stakeholders

Why "One Machine, Many Products" Changes the ROI Equation
A production manager stares at a downtime log showing 14 hours of lost capacity last week. The machine in question runs three different products. Each switchover eats 45 minutes. That is 135 minutes a day — over 11 hours a week — spent on changeovers alone. Multiply that across six machines and the numbers become staggering.
Traditional ROI models treat mold changeover savings as a linear equation: reduce changeover time by X minutes, multiply by the machine's hourly rate, and you get Y dollars saved. This approach works for a single-product line. It collapses when you apply it to a machine running multiple products.
The reason is changeover frequency leverage. A machine that switches products four times a day does not just save four times the minutes — it unlocks compounding gains in scheduling flexibility, inventory reduction, and capacity that a single-product line never accesses. Ignoring this multiplier effect understates ROI by 40–60% in most multi-product environments.
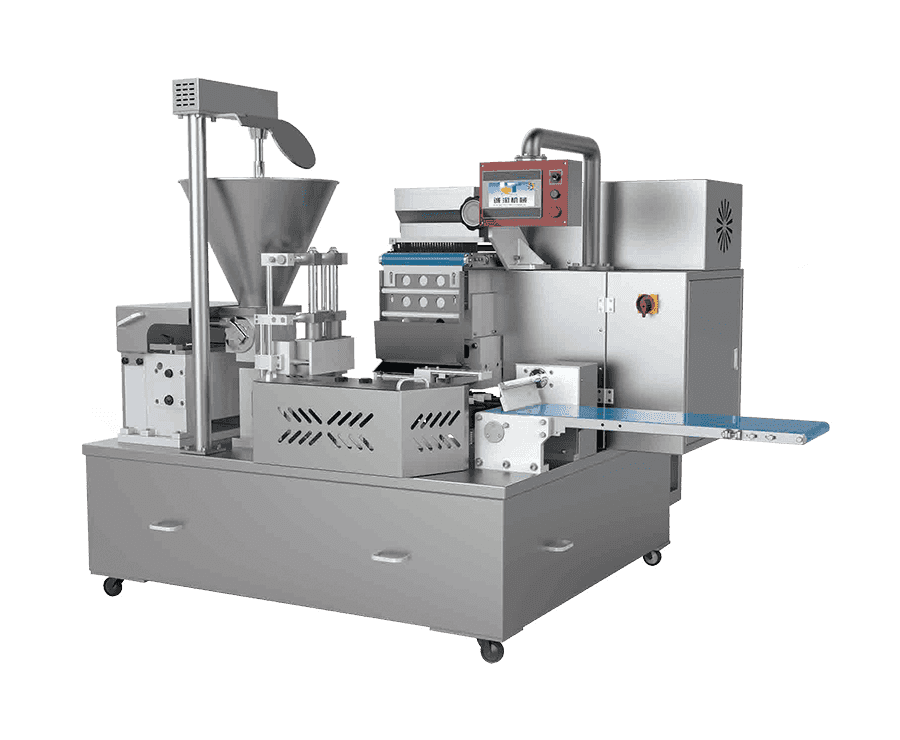
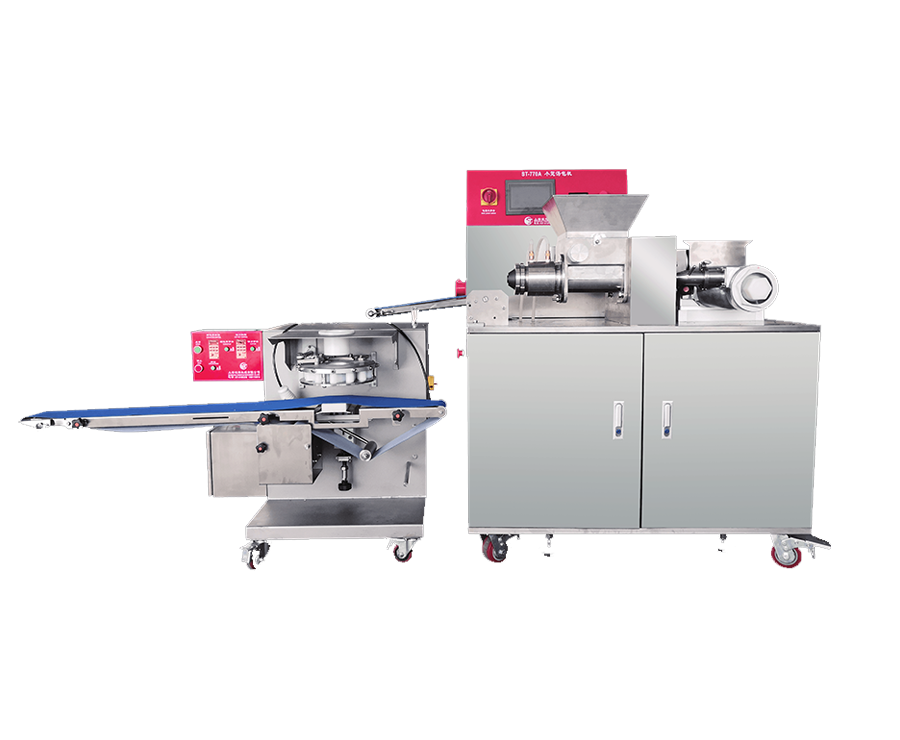
Consider a mid-sized food processing plant running a single automatic encrusting machine to produce dumplings, filled buns, and mooncakes. With manual clamping, each switch costs 40 minutes. With a quick-change system, that drops to 8 minutes. The daily saving is 96 minutes. But the real story is what those 96 minutes enable: an additional production run, same-day response to a rush order, or the elimination of a Saturday shift.
The frequency effect reshapes the entire ROI timeline. When changeovers drop from an hour to under 10 minutes, production planners stop batching large runs to amortize setup time. They start scheduling based on actual demand. Inventory carrying costs fall. Cash flow improves. These secondary gains rarely appear in a standard payback calculation — yet they often exceed the primary time savings in dollar terms.
The Complete ROI Formula for Mold Changeovers
Most ROI formulas stop at time saved multiplied by machine rate. That number tells less than half the story. A complete model must account for direct savings, indirect savings, and avoided costs — all weighed against the total investment required to implement the quick-change system.
The full formula breaks down as follows:
Annual Net ROI = (Direct Savings + Indirect Savings + Avoided Costs) - (Annualized Investment + Annual Maintenance)
Each component requires its own calculation. Direct savings come from reduced downtime: multiply the minutes saved per changeover by the number of changeovers per year, then multiply by the fully burdened machine rate. Indirect savings include labor reallocation, reduced inventory holding costs, and energy savings from fewer startup cycles. Avoided costs capture the scrap and rework that never happen because the changeover is precise and repeatable.
The table below maps every variable and its data source:
| Variable | How to Measure | Typical Data Source |
|---|---|---|
| Minutes saved per changeover | Time study (before vs. after) | Shop floor observation / video analysis |
| Changeovers per year | Count all product switches | Production schedule logs |
| Fully burdened machine rate ($/hr) | Include labor, energy, overhead allocation | Cost accounting system |
| Scrap rate delta (%) | Measure first-run scrap before and after | Quality inspection records |
| Material cost per kg/lb | Weighted average across SKUs | Procurement records |
| Inventory carrying cost (%) | Annual holding cost as % of inventory value | Finance department (typically 15–25%) |
| QMC system investment | Equipment + installation + training | Supplier quotation |
| Annual maintenance cost | Spare parts + service contracts | Supplier / maintenance logs |
A common mistake is using the standard hourly machine rate without burdening it. The fully burdened rate includes operator wages, benefits, energy consumption, floor space allocation, and depreciation. For most production machines, this figure runs 1.8 to 2.5 times the unburdened rate. Using the wrong number can understate annual savings by tens of thousands of dollars.
Another frequent omission is the scrap reduction value. The first several cycles after a manual changeover produce parts that are out of specification — incorrect weight, inconsistent seal, misaligned crimp. A quick-change system with guided alignment and repeatable clamping force eliminates this variability. If a line produces 200 kg of waste per week from changeover-related misalignment, and material costs $3.50 per kg, that is $36,400 in annual scrap that disappears from the P&L.
Comparing QMC Solutions: Hydraulic, Magnetic, and Manual Systems
Not all quick-change systems deliver the same ROI profile. The choice among hydraulic clamping, magnetic clamping, and upgraded manual systems determines the upfront investment, ongoing operating costs, and the speed improvement ceiling. Selecting the wrong system for your tonnage and changeover frequency erodes returns — sometimes below the cost of doing nothing.
Each technology occupies a distinct position on the cost-versus-speed curve:
| Criterion | Hydraulic Clamping | Magnetic Clamping | Manual Quick-Release |
|---|---|---|---|
| Typical investment (USD) | $25,000–$60,000 | $18,000–$45,000 | $3,000–$15,000 |
| Changeover speed | 2–5 minutes | 3–8 minutes | 10–20 minutes |
| Applicable machine size | Large (500+ tons) | Medium (100–500 tons) | Small (under 100 tons) |
| Annual maintenance cost | High (hydraulic seals, hoses) | Low (no moving parts on platen) | Minimal (mechanical wear only) |
| Energy consumption | Continuous pump operation | Power only during clamping | None (fully manual) |
| Mold compatibility requirements | Standardized back plates | Flat magnetic surface required | Minimal modification needed |
| Best suited for | High-frequency changes, large molds | Medium molds, clean environments | Low-frequency changes, budget-constrained |
Hydraulic systems dominate large-tonnage applications because they generate the clamping force needed for molds weighing several tons. The speed advantage is real — sub-3-minute changeovers are achievable — but the hydraulic power unit runs continuously, adding $3,000–$6,000 annually in energy costs. Maintenance on seals, hoses, and solenoid valves adds another layer of operating expense.
Magnetic clamping has gained significant traction in medium-tonnage applications. The absence of moving parts on the platen face eliminates a major wear point. Energy draw occurs only during the magnetization and demagnetization cycles — roughly 15 seconds each. The trade-off is upfront cost and the requirement that mold bases have a flat, ferromagnetic mounting surface. Retrofitting existing molds to meet this specification can add $2,000–$8,000 to the project depending on the mold inventory size.
Manual quick-release systems — toggle clamps, cam-lock bolts, and standardized locating rings — represent the entry point. They reduce changeover time by 40–60% with minimal capital expenditure. For a small production line running forming equipment with infrequent product switches, this may be the optimal economic choice. The ROI period is often under 6 months, compared to 12–18 months for hydraulic or magnetic systems. However, the speed ceiling is real: manual systems rarely achieve changeovers below 10 minutes.
The Hidden Costs You Are Not Including (But Should)
The visible costs — equipment price, installation labor, training days — appear on every capital expenditure request. The hidden costs are what separate a good ROI analysis from one that surprises the finance team 18 months later with unbudgeted expenses. Five categories consistently go unaccounted for in changeover ROI models.
First, startup scrap and rework. Every time a mold or forming die is removed and reinstalled, the first production cycles carry a higher defect risk. Manual alignment introduces positioning variance. A misalignment of 0.5 mm on a dumpling-forming die produces leaking product, inconsistent weights, and customer returns. Measuring the scrap differential between manual and quick-change setups — and pricing it at full material cost plus lost production time — often reveals $15,000–$40,000 in annual waste that a guided quick-change system eliminates.
Second, mold and die wear acceleration. Repeated manual handling increases the probability of edge damage, surface scoring, and locating-pin deformation. Each incident triggers a toolroom repair that costs $500–$2,500 and removes the mold from production for days. Quick-change systems reduce handling touches by 70–90%, directly extending tool life.
Third, sanitation and cleaning time. In food processing, changeovers include mandatory washdown cycles between allergen or product types. A mold change that takes 8 minutes mechanically may still require 60 minutes of cleaning. Quick-change designs that incorporate tool-free disassembly and smooth surfaces reduce cleaning time from 60 minutes to 15–20 minutes. At three changeovers per day, that recovery of 120 minutes of production time is material to the ROI.
Fourth, operator training and turnover costs. Manual changeovers depend on skilled technicians who understand the nuances of each mold-mounting sequence. When that technician leaves, changeover times spike until the replacement develops the same familiarity. A standardized quick-change system reduces the skill premium, making changeovers consistent regardless of who executes them.
Fifth, opportunity cost of lost production capacity. This is the hardest number to pin down but often the largest. If faster changeovers free up 400 production hours annually, and those hours enable the company to accept a new contract worth $120,000 in margin contribution, that figure belongs in the ROI calculation. Ignoring it undervalues the investment by focusing solely on cost reduction while missing revenue expansion.
Step-by-Step: How to Audit Your Current Changeover Time
You cannot calculate ROI without a baseline. Guessing your current changeover time produces a guess of an ROI — and that guess will be wrong. A structured time audit provides the hard data needed to build a defensible business case. The process takes one full day of observation per machine and follows five steps.
- Record the complete changeover process on video. Position a camera with a clear view of the entire work zone. Record at least three complete changeovers — ideally across different shifts and operators — to capture variability. Do not announce the recording as a performance test; the goal is to observe normal practice, not a hurried demonstration.
- Classify every action as internal or external. Internal actions are tasks that can only be performed while the machine is stopped (removing the mold, cleaning surfaces, installing the new mold). External actions are tasks that could be done while the machine is still running (preheating the next mold, staging tools, preparing material). The SMED methodology identifies external tasks currently performed as internal — these are your fastest, lowest-cost improvement opportunities.
- Measure elapsed time for each step using the video timestamp. Break the changeover into discrete steps: last good part to machine stop, mold cooling, clamp release, mold removal, platen cleaning, new mold positioning, clamp engagement, alignment verification, first part to quality check. Record each step's duration to the second.
- Identify bottlenecks and waiting periods. Look for steps where the operator waits — for the mold to cool, for a forklift to arrive, for quality approval. These waiting periods are pure waste. In a typical unaudited changeover, waiting accounts for 25–35% of total elapsed time.
- Calculate the theoretical minimum changeover time. Add the durations of all internal steps that cannot be eliminated or converted to external. This is your target with a quick-change system. The gap between your current average and this theoretical minimum is the time savings available for your ROI calculation.
A well-executed audit typically reveals that 30–50% of changeover time consists of tasks that can be externalized with better preparation and standardized tooling — no capital expenditure required. The remaining gap is where quick-change equipment delivers its value. Documenting both portions separately strengthens the investment case by showing management that process improvements have already been exhausted before capital is requested.
Case Study: One Machine, Three Products — A Food Manufacturing Example
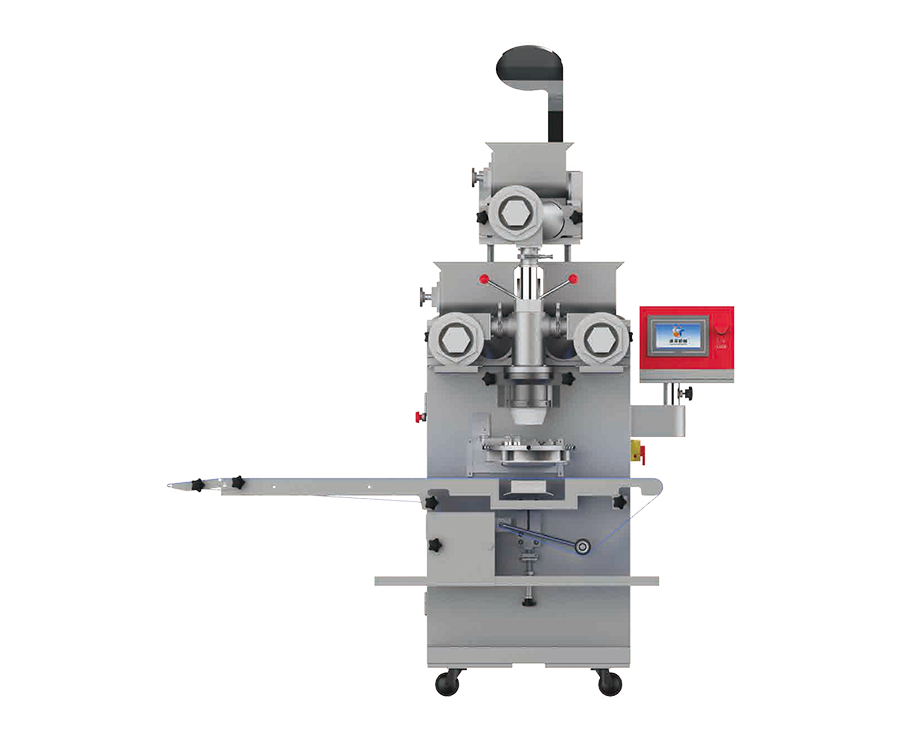
Abstract ROI formulas are persuasive. Concrete numbers close deals. The following case models a mid-volume food processor using a single ST168 plus automatic encrusting machine to produce three products: 25g dumplings, 40g siomai, and 50g filled buns. The machine runs two shifts, five days per week, 50 weeks per year. Before the quick-change upgrade, each product switch consumed 42 minutes. After upgrading to a standardized quick-change system with guided die alignment, changeover time dropped to 9 minutes.
| Metric | Before QMC | After QMC | Delta |
|---|---|---|---|
| Changeover time (minutes) | 42 | 9 | 33 minutes saved per switch |
| Daily changeovers | 3 | 3 | No change — same product mix |
| Daily downtime from changeovers (min) | 126 | 27 | 99 minutes recovered per day |
| Annual recovered hours | — | — | 412 hours |
| Startup scrap rate | 2.8% | 0.6% | 2.2 percentage points |
| Annual scrap cost (material at $3.50/kg) | $31,200 | $6,700 | $24,500 saved |
| Annual cleaning time (hours) | 312 | 104 | 208 hours recovered |
| Total annual savings (time + scrap + cleaning) | — | — | $71,340 |
The numbers break down as follows. The 412 recovered production hours, at a fully burdened machine rate of $85 per hour, contribute $35,020 in direct savings. The scrap reduction adds $24,500. The 208 hours of recovered cleaning time, valued at the operator labor rate of $28 per hour (including benefits), contribute $5,824. Combined, the annual savings reach $65,344 before accounting for any revenue upside from the additional capacity.
The total investment for the quick-change system — including standardized die holders, guided alignment rails, tool-free clamping, and one day of operator training — came to $31,000. The payback period: 5.7 months. The three-year ROI exceeds 530%.
What this case does not capture — but what the production manager will notice within weeks — is the scheduling flexibility. When a changeover takes 9 minutes instead of 42, the planner can insert a small rush order between two scheduled runs without disrupting the day. That responsiveness has a market value that shows up in customer retention and new business wins over time.
Decision Matrix: Which QMC Strategy Fits Your Business?
The right quick-change strategy depends on two variables: the scale of your operation and the diversity of your product mix. A small shop running one product all week faces a completely different ROI equation than a mid-sized plant switching products three times daily. The matrix below maps recommended strategies to common operational profiles.
| Single Product / Low Variety | Multiple Products / High Variety | |
|---|---|---|
| Small Operation (under 20 employees, 1–2 machines) | Manual quick-release upgrades. Target 40% time reduction. Expected ROI: 4–8 months. Investment range: $3,000–$8,000. | Manual quick-release plus standardized die holders and pre-staging carts. Target 50% time reduction. Expected ROI: 3–6 months. Investment range: $8,000–$18,000. |
| Mid-Size Operation (20–100 employees, 3–8 machines) | Magnetic clamping on primary production machines. Target 70% time reduction. Expected ROI: 10–14 months. Investment range: $18,000–$35,000 per machine. | Magnetic or hydraulic clamping depending on tonnage, plus full SMED implementation. Target 80% time reduction. Expected ROI: 6–12 months. Investment range: $25,000–$50,000 per machine. |
| Large Operation (100+ employees, 8+ machines) | Hydraulic clamping on high-tonnage lines, magnetic on medium lines. Full integration with production scheduling software. Expected ROI: 12–18 months. Investment range: $35,000–$60,000 per machine. | Full hydraulic QMC across all compatible machines, standardized mold bases across entire fleet, automated mold preheating and staging. Expected ROI: 8–14 months. Investment range: $45,000–$70,000 per machine plus mold retrofit costs. |
The matrix reveals a consistent pattern: the payback period compresses as product variety increases, even though the investment level rises. This is the frequency leverage effect in action. A large operation running a single product may wait 18 months for payback. The same operation running five products across the same machines sees payback in 10 months or less — simply because the system saves time multiple times per day instead of once per week.
For operations exploring extended application possibilities — where a single base machine is configured for multiple product categories — the matrix skews even further toward aggressive quick-change investment. The ability to switch between product families without dedicated lines fundamentally changes the capacity math.
Conclusion: Making the Investment Case to Stakeholders
A quick-change system competes for capital against every other project in the queue. Winning that competition requires a concise, data-backed argument that speaks the language of the CFO and operations director equally. Three numbers carry the conversation.
First, the total investment required — equipment, installation, training, and any mold retrofit costs. Bundle everything into one figure. Surprises later destroy credibility. Second, the payback period in months, calculated conservatively. Use only the direct, verifiable savings: time reduction multiplied by burdened machine rate, plus scrap reduction supported by quality records. Leave the indirect benefits as a supporting narrative, not a line item in the hard ROI. Third, the annual recurring savings after payback — the number that will appear on the P&L every year going forward.
Present these three figures on a single slide. Support them with the time audit data and the scrap analysis. Then close with the operational story: more capacity without more machines, shorter lead times for customers, and the flexibility to accept business that would otherwise go to a competitor. That combination — hard numbers plus strategic narrative — is what gets quick-change projects approved.
Related Products
Copyright © Shanghai Chengtao Machinery Co., Ltd. All rights reserved.  Food Machinery Manufacturers
Contact Us