
 en
en English
 Español
 Français
 русский
 عربى
عربى
Downtime Cost Visibility: Build a Failure-Cause-Spare Parts Knowledge Base
Content
- 1 The Real Cost of Downtime in Food Production — and Why Most Plants Can't See It
- 2 Why a Failure–Cause–Spare Parts Knowledge Base Is the Missing Link
- 3 Step-by-Step: Building Your Knowledge Base from Scratch
- 4 A Practical Field Template: What Each Knowledge Base Entry Should Contain
- 5 How an Equipment OEM Can Accelerate Your Knowledge Base
- 6 Turning Visibility into Action: Using the Knowledge Base for Smarter Buying and Maintenance
- 7 Start Small, But Start Now: A 90-Day Action Plan
When a forming machine stops mid-shift on a dumpling line, the visible cost—repair labor and the replacement part—rarely tells the full story. The thousands of dollars in lost output, the wages of 20 idle workers, the overnight shipping premium for a shaft seal, and the customer deduction for late delivery remain invisible in most maintenance logs. This is the core problem of downtime cost visibility: if you cannot trace a stoppage to its root cause and the spare parts it consumed, you can only estimate the damage after the fact.
Building a failure–cause–spare parts knowledge base closes this gap. It transforms scattered maintenance records and tribal knowledge into a structured system that assigns a cost to every stoppage, reveals repeat failure patterns, and connects each fault to the exact parts needed for repair. For food producers, this is the practical foundation for moving from reactive firefighting to planned, data-driven maintenance.
The Real Cost of Downtime in Food Production — and Why Most Plants Can't See It
Public industry research consistently suggests that unplanned downtime costs manufacturers over $50 billion annually in the United States alone, with average hourly costs exceeding $260,000 across sectors. But these headline figures can mislead a single plant. What matters more is that over 80% of companies cannot accurately compute their own true downtime cost, because they only capture the obvious out-of-pocket expenses.
Direct vs. Hidden Costs: What the Ledger Doesn't Show
Direct costs include lost production output, repair labor, and the actual price of replacement parts. Hidden costs, however, often multiply the damage by two to three times. In a food production environment, these hidden costs take very specific forms:
- Idle labor: Line operators and packers still get paid while the equipment sits still.
- Expedited parts procurement: A $50 bearing can become a $250 expense when it requires courier delivery.
- Cold chain disruption: Filling machines, mixers, and forming equipment stop, and partially processed dough or filling may need to be discarded due to temperature or hygiene limits.
- Sanitation reverification: If a repair breaches a sealed food-contact zone, the line must be cleaned and re-verified per HACCP protocols before restarting, adding hours of lost time.
- Delivery penalties and trust erosion: Missed orders trigger contractual deductions; repeat delays push customers toward competitors.
Consider one hour of unplanned downtime on a mid-speed dumpling production line producing 2,000 pieces per hour at a wholesale value of $0.30 per piece. The output loss alone is $600. Add 20 operators at $15/hour, one maintenance technician at $30/hour, a $200 rapid-procurement markup for a gearbox seal, and half an hour of sanitation re-verification. That single hour exceeds $1,000 before you account for customer penalties. The fundamental takeaway: financial systems will not show you this number until you deliberately structure maintenance data to calculate it.
For a deeper look at reducing shift-change stoppages in this context, review three proven ways to cut downtime during shift changes.
Why a Failure–Cause–Spare Parts Knowledge Base Is the Missing Link
The barrier to downtime cost visibility is not a lack of data. It is the absence of a traceable chain from each stoppage event to its root cause and the parts that resolved it. Industry analyses across sectors note that spare parts shortages contribute to up to 40% of unplanned downtime. When a technician cannot quickly identify the exact part needed—or the part is not stocked—a 30-minute fix stretches into a 4-hour wait.
A knowledge base solves this by organizing three interconnected layers:
- Failure record layer: What exactly happened? Capture the symptom, timestamps, equipment identity, line operator, and production shift.
- Root cause layer: Why did it happen? Document the physical mechanism—wear, blockage, temperature drift, or operator error—and distinguish the direct cause (e.g., mold wear) from the broader systemic cause (e.g., replacement intervals set too long).
- Spare parts linkage layer: What is needed to fix it? Associate every root cause entry with specific SKUs, current stock levels, reorder points, and supplier lead times.
Without this chain, downtime costs remain a guessing game. With it, every stoppage becomes a teachable data point that guides inventory planning, maintenance scheduling, and equipment selection.
Step-by-Step: Building Your Knowledge Base from Scratch
The following process is designed to be practical for a plant with limited engineering resources. Start with one production line, formalize the structure, and expand as the system proves its value.
Step 1 — Define Failure Categories and Codes for Each Machine Module
Generic codes like "mechanical fault" are useless for pattern analysis. Instead, classify failures by equipment functional module—the physical subsystem that failed—and then by the specific symptom. For example, an automatic encrusting machine might have categories for the forming mold, filling pump, conveyor drive, temperature control, and safety interlock. Within the filling pump module, symptoms may include "blockage," "leakage," and "pressure loss."
Use a consistent alphanumeric coding scheme so any operator records the fault the same way. A workable format is [Equipment Module Code]-[Symptom Code]-[Severity 1-4]. For instance, FP-BLK-2 could mean "Filling Pump – Blockage – Moderate impact." Severity ratings help prioritize response and later, cost review.
When building this structure for a heavy-duty dough mixer for production lines, you would define modules such as the motor drive (belt wear, overload), the mixing shaft (seal leakage, blade gap deviation), and the safety guard (interlock failure). For a fermentation cabinet, modules would include the fan, heating element, humidity sensor, and door seal. Defining these modules upfront prevents ambiguous entries and makes future root cause analysis far more reliable.
Step 2 — Build the Cause Library: Documenting Root Causes, Not Just Symptoms
The knowledge base will only reduce downtime if it explains why a failure happened. For each failure category, create a pre-populated list of known root causes based on your experience, OEM guidance, and maintenance history. This turns every stoppage into a guided diagnosis. For example, for "Filling Pump – Blockage – Moderate," the cause library might include:
- Ingredient recipe change: A higher-viscosity filling batch clogs the pump rotor.
- Incomplete inter-batch cleaning: Dried residue restricts the flow path.
- Mechanical wear: Rotor clearance has widened due to extended service.
- Foreign object ingress: A small piece of bone or gristle entered the hopper.
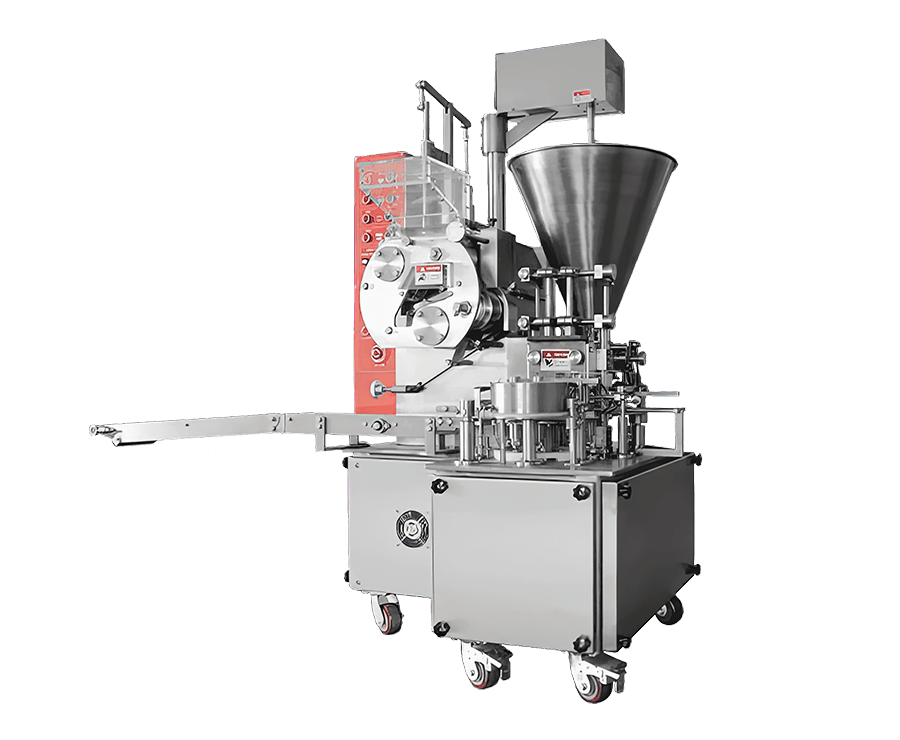
Always record both the direct cause (immediate trigger) and the root cause (underlying deficiency). Public engineering surveys indicate that aging assets and mechanical wear account for over 60% of unplanned failures. In food equipment, the pattern is often driven by harsh cleaning chemicals accelerating seal deterioration, or by scheduled replacement intervals that are longer than the real-world wear rate. For practical troubleshooting examples, refer to the guidance on resolving common mechanical issues in high-speed siomai makers. This field-level perspective is where repair knowledge becomes a reusable asset.
Step 3 — Link Each Failure Cause to the Right Spare Parts (and Lead Times)
Knowing that a pump rotor needs replacement is meaningless if the part is not in stock. The central value of the knowledge base emerges in this step: connecting each root cause to a recommended bill of materials. For every cause entry, associate the specific spare parts with their SKU, where they are stored, the minimum stock quantity, and the current supplier lead time.
A basic spare parts linkage table structure looks like this:
| Equipment Module | Root Cause Category | Suggested Part | SKU | Safety Stock | Lead Time (Days) |
|---|---|---|---|---|---|
| Filling Pump | Rotor Wear | Trochoid Pump Rotor Set | FP-ROTOR-006 | 2 | 7 |
| Fermentation Cabinet | Fan Motor Failure | Centrifugal Fan Assembly | FC-FAN-014 | 1 | 4 |
| Dough Mixer | Belt Slippage | V-Belt Set A-38 | DM-BELT-023 | 3 | 2 |
For a specific example related to baking equipment, the commercial fermentation cabinet for bakeries has a fan cover that is critical for air circulation and hygiene; tracking its replacement cycle is a direct case of this linkage. The act of building this table will immediately expose which high-frequency failures lack a stocking strategy.
Step 4 — Define Baseline Costs: Turning Records into Money
Cost visibility requires standardizing the financial portion of each record. Every knowledge base entry should include the following cost-related fields: total downtime duration, production output loss, labor cost per hour, spare part cost, expediting fees, and a calibration factor for hidden costs.
Use this simplified formula for a single stoppage:
Total Downtime Cost = (Downtime Hours × Lost Output per Hour × Unit Value) + (Downtime Hours × Total Labor Rate) + Spare Parts Cost + Hidden Cost Factor
The hidden cost factor includes expedited shipping premiums, sanitation re-verification time, and contract penalties—estimate it as a percentage of direct costs based on your specific operation, typically starting between 50% and 200%. Calibrate this factor quarterly by reviewing actual spending versus the estimate.
A Practical Field Template: What Each Knowledge Base Entry Should Contain
To make this concept immediately useful, use a structured template for every new entry. A "minimal viable" version suitable for spreadsheets or a small CMMS includes the following fields:
- Basic information: Equipment ID, machinery model, failure date and time, production shift, line operator name.
- Failure details: Fault code, symptom description, severity level (1–4), equipment module.
- Root cause details: Root cause category (from step 2), direct cause description, root cause analysis (a short 5-Whys or fishbone exercise), and remediation taken.
- Spare parts record: SKU, quantity consumed, source (stock or emergency purchase), and waiting time for the part.
- Cost breakdown: Total downtime hours, production output lost, labor cost, spare parts cost, hidden cost factor, and final estimated total cost.
- Preventive action: Recommended action to avoid recurrence, suggested date for next inspection, and whether the scheduled maintenance plan needs adjustment.
Do not overcomplicate the first version. Start with these fields; after a few months, you can add fields for energy consumption or quality rejection rates if needed.
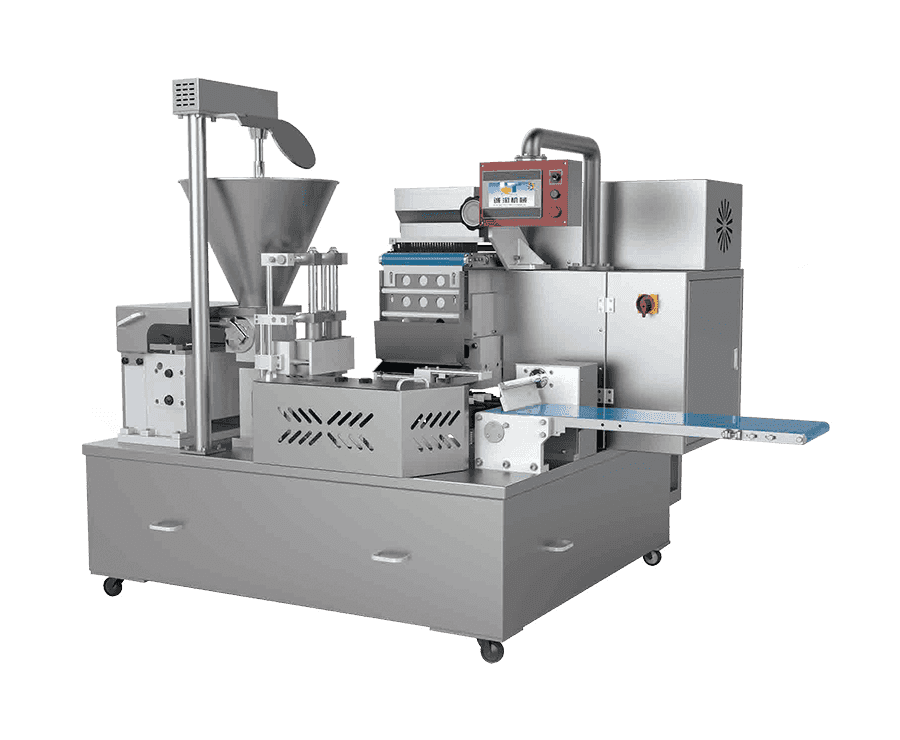
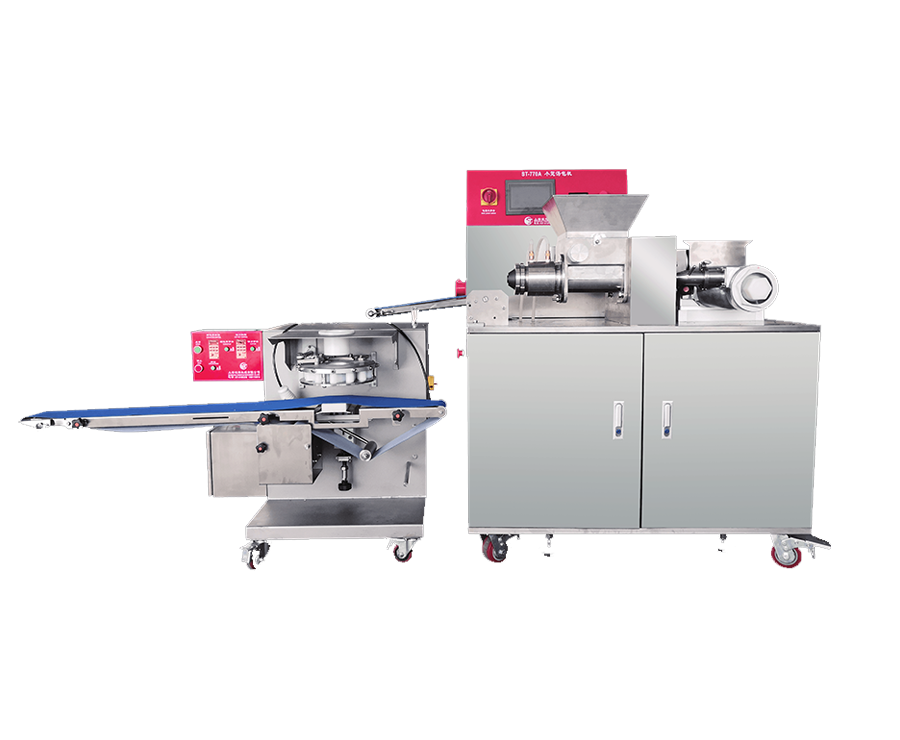
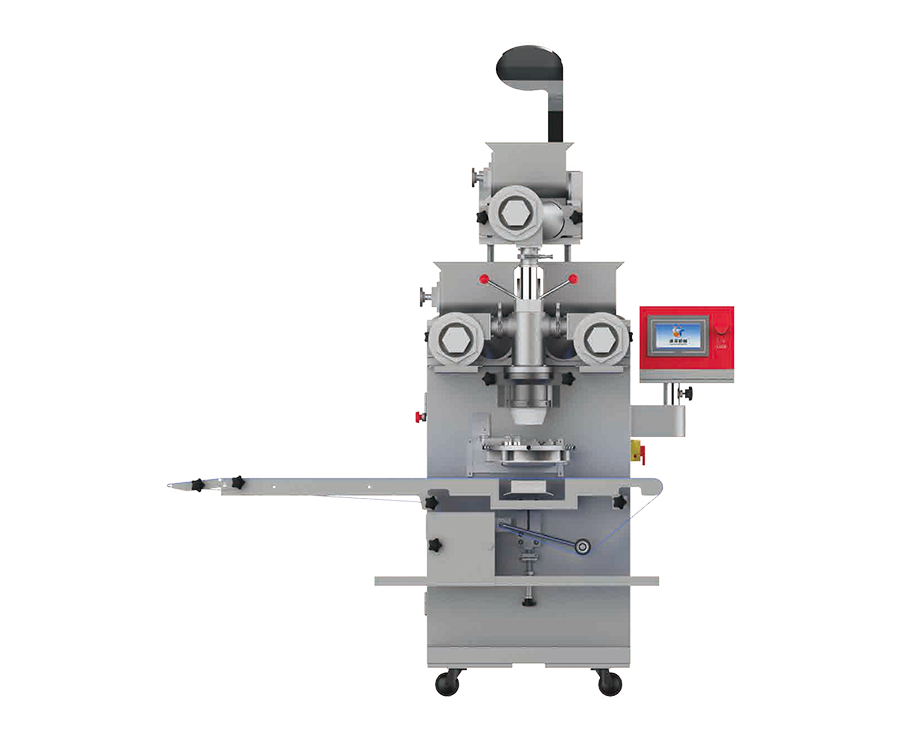
When setting up this template for your preparing equipment, the automatic encrusting machine with tray arranging could serve as a pilot to build your initial failure dictionary and spare parts BOM—it is a modular machine where clear fault categorization directly shortens repair time.
How an Equipment OEM Can Accelerate Your Knowledge Base
Internal teams can spend months manually documenting failure codes and part numbers. A meaningful shortcut exists: the equipment manufacturer (OEM) already holds most of the required knowledge, including failure mode databases, original spare parts BOMs, and tolerance specifications. The challenge is institutional: this data often stays buried within design documents or field service reports.
An experienced food machinery OEM can accelerate your knowledge base construction in four ways:
- Pre-built failure dictionary: Sharing the list of known failure modes per equipment module, their associated severities, and recommended root cause checks.
- Original spare parts BOM with recommended safety stock: A structured list of critical wearable parts, their expected lifespan under typical usage, and suggested stock levels.
- Knowledge base initialization template: A pre-formatted Excel or CMMS import file that matches the machine's core components to likely failure scenarios.
- Remote diagnostic support: Assisting in validating root cause hypotheses for complex or repetitive failures, ensuring your knowledge base documents the true underlying mechanism.
When prospective buyers evaluate machinery, the willingness of a supplier to provide this depth of technical documentation is a strong signal of long-term partnership. It shifts the procurement conversation from "Does this machine work?" to "How will we maintain it efficiently over the next 10 years?" This is a key reason why plant managers should prioritize OEMs that offer robust after-sales knowledge transfer.
Turning Visibility into Action: Using the Knowledge Base for Smarter Buying and Maintenance
A knowledge base is a management infrastructure, not a compliance exercise. After 6 to 12 months of consistent data, three operational improvements materialize.
Maintenance strategy upgrade. The fault frequency data reveals which components fail before their scheduled maintenance interval. Instead of relying solely on calendar-based replacements, your team can shift to condition-based or usage-based replacement. For example, if the mold wear on your encrusting machine consistently causes dough sticking at 900 production hours, you can schedule a pre-emptive mold change at 850 hours. This is a direct move from reactive to preventive—and eventually predictive—maintenance.
Inventory optimization. The spare parts linkage table shows which SKUs are consumed most frequently and which have long lead times. Combining this consumption data with an ABC analysis (for part cost) and a criticality rating (for downtime impact) helps you decide whether to stock an item, the ideal quantity, and how to differentiate between high-turnover wear parts and low-turnover safety stock. The result is low inventory holding costs without emergency procurement panic.
Smarter equipment procurement. The knowledge base becomes a powerful evaluation tool for the next capital purchase. Historical failure data from your existing machines provides a baseline for Mean Time Between Failures (MTBF) and typical maintenance cost per hour of operation. When comparing a new automatic encrusting machine with tray arranging against another brand or an older internal model, your database gives you a data-backed view of expected maintenance burden, not just the initial purchase price. This same logic applies when considering how to scale operations by following a 3-step framework for scaling from single machines to full production lines.
Maintaining an accurate downtime cost metric can also help operations managers navigate the unique pressures of balancing throughput, hygiene, and stability in frozen food production.
Start Small, But Start Now: A 90-Day Action Plan
You do not need to build a perfect system on day one. A pragmatic three-month plan will create enough momentum to evaluate the value of the approach:
- Day 1–30 — Pilot line setup. Choose one core production line (e.g., a dumpling or siomai line). Define failure categories for each equipment module, agree on the fault-code format, and create the digital or paper-based recording template. Start capturing data for every positive stoppage. Do not worry about historical data; focus on capturing new events accurately.
- Day 31–60 — Build the cause library and link spare parts. Review the recorded failures from the first month. For the top 10 most frequent failure codes, document the confirmed root causes and link them to the specific spare parts with SKUs and lead times. Collaborate with your maintenance team to validate this information.
- Day 61–90 — Calculate and analyze. For every recorded failure, fill in the cost fields (downtime, labor, parts, hidden factor). At the end of the month, create a summary table: list the top 5 highest-cost failures, rank the most frequent root causes, and identify which spare parts gaps caused the longest downtime. Use this report to propose at least one preventive maintenance change and one inventory adjustment before the next quarter.
The goal of the first 90 days is not to solve every maintenance problem. It is to establish a repeatable loop of recording, costing, and analyzing. Once this loop functions, downtime cost visibility is no longer a theoretical metric—it becomes a weekly management tool that directly informs maintenance planning, inventory purchasing, and, importantly, your evaluation of future equipment purchases.
Related Products
Copyright © Shanghai Chengtao Machinery Co., Ltd. All rights reserved.  Food Machinery Manufacturers
Contact Us